The last DAW post gave the song a timeline. You could arrange it. You still could not see what it sounded like, and a mix you cannot inspect is a mix you fix by guessing.
This pass adds three analysis widgets to entropy_gui, an oscilloscope, a spectrum analyzer and a level meter, and puts them in the DAW: a floating Analyzer window, a meter on every mixer strip, and a master strip. To feed them the audio engine grew a real master bus and lock-free taps. An AI tool, daw_analyze_mix, reads the same taps, so a chat can check its own mix.
The working tree is uncommitted as I write this, so there is no commit or tag to point at.
What changed
- A master bus. Every track bus used to be its own
rodio::Sinkon the output stream. They now sum into one master mixer with a single sink. There is finally one place that hears the whole mix. - Analysis taps. A lock-free ring buffer sits on every track bus and on the master. The audio thread writes to it. Nothing else runs there.
Oscilloscope. Triggered to a fraction of a sample so a steady tone holds still, with afterglow, and Mono, Stereo and XY (goniometer) modes.SpectrumView. A logarithmic frequency axis, fixed-rate falloff, peak hold, a hover readout with note names, and a bars style.LevelMeter. Peak and RMS, measured since the last frame, with peak hold and a clip latch you click to clear.Entropy.Audio.analyze(source)and thedaw_analyze_mixtool: peak, RMS, strongest frequency and spectral centroid for the master or any track.- Five test tiers, including a headless one that rasterizes the widgets' real draw lists on the CPU and asserts on pixels.
Listening without touching the signal
The constraint is that the audio thread must do almost nothing. It writes stereo frames into a ring:
#[inline]
pub fn push(&self, l: f32, r: f32) {
    let w = self.written.load(Ordering::Relaxed);
    fence(Ordering::Release);
    let i = (w as usize) & (TAP_FRAMES - 1);
    self.left[i].store(l.to_bits(), Ordering::Relaxed);
    self.right[i].store(r.to_bits(), Ordering::Relaxed);
    self.written.store(w + 1, Ordering::Release);
}
Samples are f32 bit patterns in atomics, so there is no unsafe and no torn float. written is a clock that never resets. The ring holds 16,384 frames, 371 ms at 44.1 kHz. Everything else (copying a window out, windowing, the FFT) happens on the UI thread, on demand, for a source a widget actually asks about.
Reading a ring while it is written is a seqlock problem, and the read side is where it went wrong first (failure notes). The finished version copies the newest frames, then checks that the writer has not come all the way round to the oldest frame it took. If it has, the copy is retaken, and after three tries it is trimmed to the suffix that provably survived:
let now = self.written.load(Ordering::Relaxed);
if now - start < TAP_FRAMES as u64 {
    return (left, right, end);          // intact
}
// ... after the last attempt: drop the torn prefix
let first_safe = now + 1 - TAP_FRAMES as u64;
A shorter window is a fine answer. A window with a splice in it is not.
The master bus
Before this, each track bus was a never-ending source appended to its own Sink, and the sink was the handle that stopped a deleted track. Now there is one master rodio::mixer and one MasterBusSource on it. A track bus is a source added to that mixer, and it ends itself when an alive flag drops. The master tap sits on the sum, so it hears what the speakers get. I did not sum the per-track taps after the fact because each bus has its own frame counter, and they only line up to within one callback buffer. A master scope built that way would draw a waveform that was never played.
Each track's tap sits after its effects, gain, mute and solo. A muted track's scope goes flat. That is deliberate: it shows what you can hear.
The DSP
SpectrumAnalyzer is a periodic Hann window and a real FFT (realfft), with plans cached per size. Three choices are worth stating:
- Calibration. The FFT is divided by
sum(window) / 2, so a full-scale sine reads 0 dBFS. A 0.25-amplitude sine reads -12.04 dBFS in the test, which is what 20 log10(0.25) is. - Channels. The two channels combine as
sqrt((|L|^2 + |R|^2) / 2)per bin. Identical channels read the same as either alone, and a hard-panned tone is 3 dB down, not the 6 dB that(L + R) / 2would say. - Pitch. The strongest bin is refined by parabolic interpolation on its dB neighbours. At every FFT size the test tone at 1 kHz is found to within a quarter bin.
The peak level is subject to Hann scalloping, up to 1.4 dB down for a tone between two bins. The engine test shows it: a 0.5-amplitude sine through the centred pan should read -9.03 dBFS, and 440 Hz reads -9.13, while 220 Hz, which sits 0.43 bins off centre, reads -10.10.
Three widgets
All three follow the shape of KanbanBoard and TrackView. The caller hands in flat data, the widget keeps only what must persist between frames (smoothed levels, peak-hold ticks, afterglow) in a new type-erased slot on Memory, and nothing in entropy_gui knows about audio. The addon engine resolves a source name to samples Rust-side when it draws the widget, so no sample array crosses into JS:
Entropy.UI.Widget.spectrum(win, { source: "trk-lead", fftSize: 4096, style: "filled", width: 380, height: 200 });
Entropy.UI.Widget.oscilloscope(win, { source: "trk-lead", mode: "stereo", trigger: true, width: 220 });
Entropy.UI.Widget.levelMeter(win, { source: "master", showScale: true, height: 200 });
The oscilloscope holds still
Draw a periodic signal from wherever the newest sample happens to be and it crawls across the screen. The widget instead finds the latest rising crossing of the trigger level that still leaves a full window after it. It arms only after the signal has dipped a hysteresis below the level (5% of the peak), so noise around the level does not fire a burst of triggers. It then locates the crossing to a fraction of a sample by linear interpolation and shifts the trace by that fraction.
The fraction matters more than it looks. At 1024 samples across 720 px, one sample is 0.7 px. Integer alignment alone would shimmer by up to that much between frames.
When the window is wider than twice the plot, the trace is reduced to a min/max pair per column, so a one-sample spike still gets drawn. When both channels are identical, as they are for a centre-panned mono source, the Stereo mode draws one trace in the track's colour, because two identical traces just hide the first colour under the second. XY mode plots left against right turned 45 degrees: mono is a vertical line, out of phase is horizontal, and a correlation bar underneath reports the Pearson coefficient.
The spectrum uses a log axis, and bins do not
A 4096-point FFT at 44.1 kHz has bins 10.8 Hz apart. On a log axis from 20 Hz to 20 kHz that is a handful of bins across the bass and dozens per pixel in the treble. So the widget treats the two ends differently. A column narrower than a bin interpolates. A column that covers several bins takes their maximum, so a narrow treble peak is never averaged away.
The interpolation is where I got it wrong the first time (failure notes). The current version runs Catmull-Rom in linear amplitude and clamps the result between the two bracketing bins, so the curve can never show a level the FFT did not measure:
let amp = |k: isize| 10.0f32.powf(at(k) / 20.0);
let (a1, a2) = (amp(k0), amp(k0 + 1));
let v = catmull_rom(amp(k0 - 1), a1, a2, amp(k0 + 2), t).clamp(a1.min(a2), a1.max(a2));
Levels rise with a short time constant and fall at a fixed 48 dB per second. The hover tag names the note and its cents (1.00 kHz -23.4 dB B5 +21c). In bars mode the axis is grouped into log bands, three to the octave by default.
The meter measures since the last frame
A meter that looks at the last 20 ms of audio misses a 10 ms kick if the UI frame runs long. The engine keeps a cursor per meter (the caller's widget id), so each read covers exactly the frames since that meter's previous read. The bar has instant attack, falls at 26 dB per second, holds a peak tick for 1.4 s, and latches a red LED when a peak reaches full scale. Clicking the meter clears it.
The DAW side
The Analyzer is a floating window, created with Entropy.UI.createWindow next to the DAW's tab. It holds a source dropdown (Master or any track), an FFT size, a spectrum style, a scope mode (Stereo, Mono, XY) and a trigger checkbox, over a spectrum, a scope and a meter. A track's source takes the track's colour. The mixer gets a Master strip and a small meter on every strip. Which source you listen to is not saved in the project. It is not something a song is made of, and a test checks that it never reaches DAW.json.
daw_analyze_mix returns, for the master and each track, the peak and RMS in dBFS, the strongest frequency with its nearest note, and the spectral centroid, measured over the last 93 ms. Its description tells the model to call it while the song plays.
Testing: five tiers
The brief for this repo is that BDD features do the checking, and screenshots and synthetic input are the evidence. Here is what each tier covers.
- Unit tests. 16 in
audio::analysisand 12 in the widget module. They cover calibration, the trigger, interpolation limits, and the seqlock stress tests. - Engine tier (
audio_analysis_bdd, 6 scenarios, 46 steps). The realAudioEngineon the real output device. Tones are played through track buses and the taps are read the way the widgets read them. - Headless widget tier (
audio_widgets_bdd, 23 scenarios, 105 steps). The real widgets through a headlessentropy_gui::Context, one 60 fps frame at a time. The test rasterizes each frame's draw list on the CPU (shapes plus glyph-atlas text, 2x supersampled) and asserts on pixels. "Lit" means a pixel differs from the same widget drawn with no signal, which cancels the panel gradient and the grid. - Addon tier (vitest, 11 new scenarios, 38 in the file). The production DAW addon against a stand-in
Entropythat records every widget it declares. This checks what the addon asks for. - Live tier (
daw_analyzer_live). The real compiled DAW, playing through the real device.
Some of what the pixel tier asserts:
| Scenario | Result |
|---|---|
| A 60, 440, 1000 and 9000 Hz tone lands on its own column of the log axis | within 2 px |
| The same tones at -6 dBFS read at | -6.3, -5.4, -6.7 and -5.4 dBFS (within 1 dB) |
| A triggered scope over 12 different starting phases | worst column moved 0.50 px |
| The same scope with the trigger off | worst column moved 118 px |
| A mono signal on the goniometer | every point within 3 px of the vertical axis, correlation +1.00 |
| The meter fills to -6 dBFS and -18 dBFS | within 2 px of the scale mark |
| A clip latches, survives 90 quiet frames, and clears on click | yes |
I checked that these tests can fail:
| Mutation | What caught it |
|---|---|
| dB calibration scaled by 1.1 | 4 unit tests |
| Torn snapshots returned untrimmed | both stress tests, on every run |
| Trigger fraction forced to 0 | the steadiness scenario, at 4.00 px against a 0.75 px limit |
| Interpolating in dB, no clamp | the unit test (drew -3.09 dB from data peaking at -6.2). Not the picture test, at its 1 dB tolerance |
| The delete-source fallback removed | exactly one addon scenario |
| Both memory fences removed | nothing, on this machine (see the failure notes) |
Evidence
The first two images are from the live tier, composited frames at 1400x900 from the running DAW. The rest are written by the headless tier's rasterizer, which is a CPU approximation of the real renderer, not a screenshot of it.
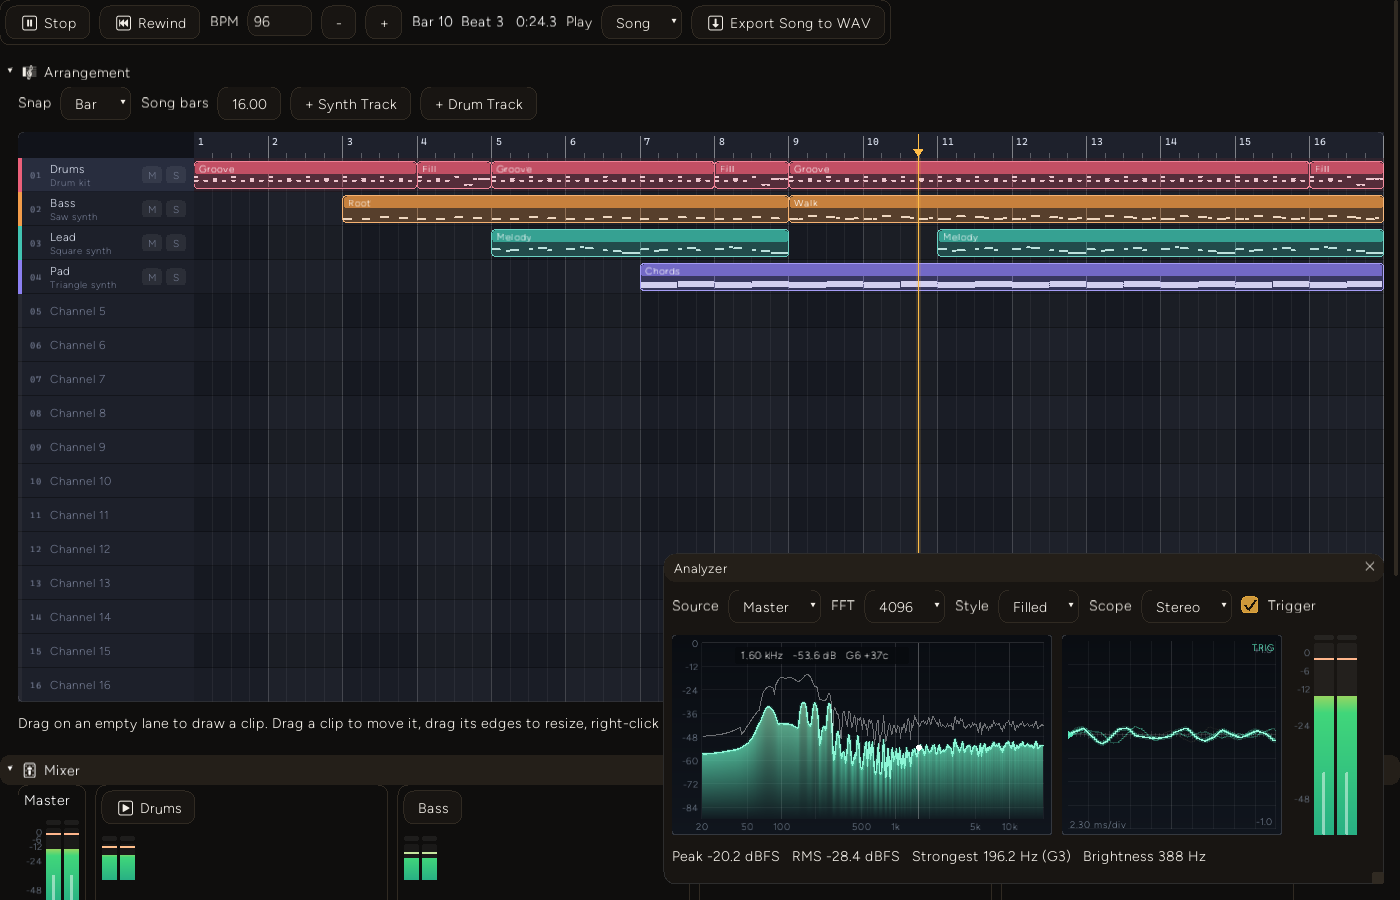
The starter song at bar 10, source set to Master. The readout under the widgets says Peak -20.2 dBFS RMS -28.4 dBFS Strongest 196.2 Hz (G3) Brightness 388 Hz. That is one 93 ms window, and it is not the song's true peak, as the live numbers below show. The hover tag near 1.6 kHz is the real OS pointer resting over the plot.
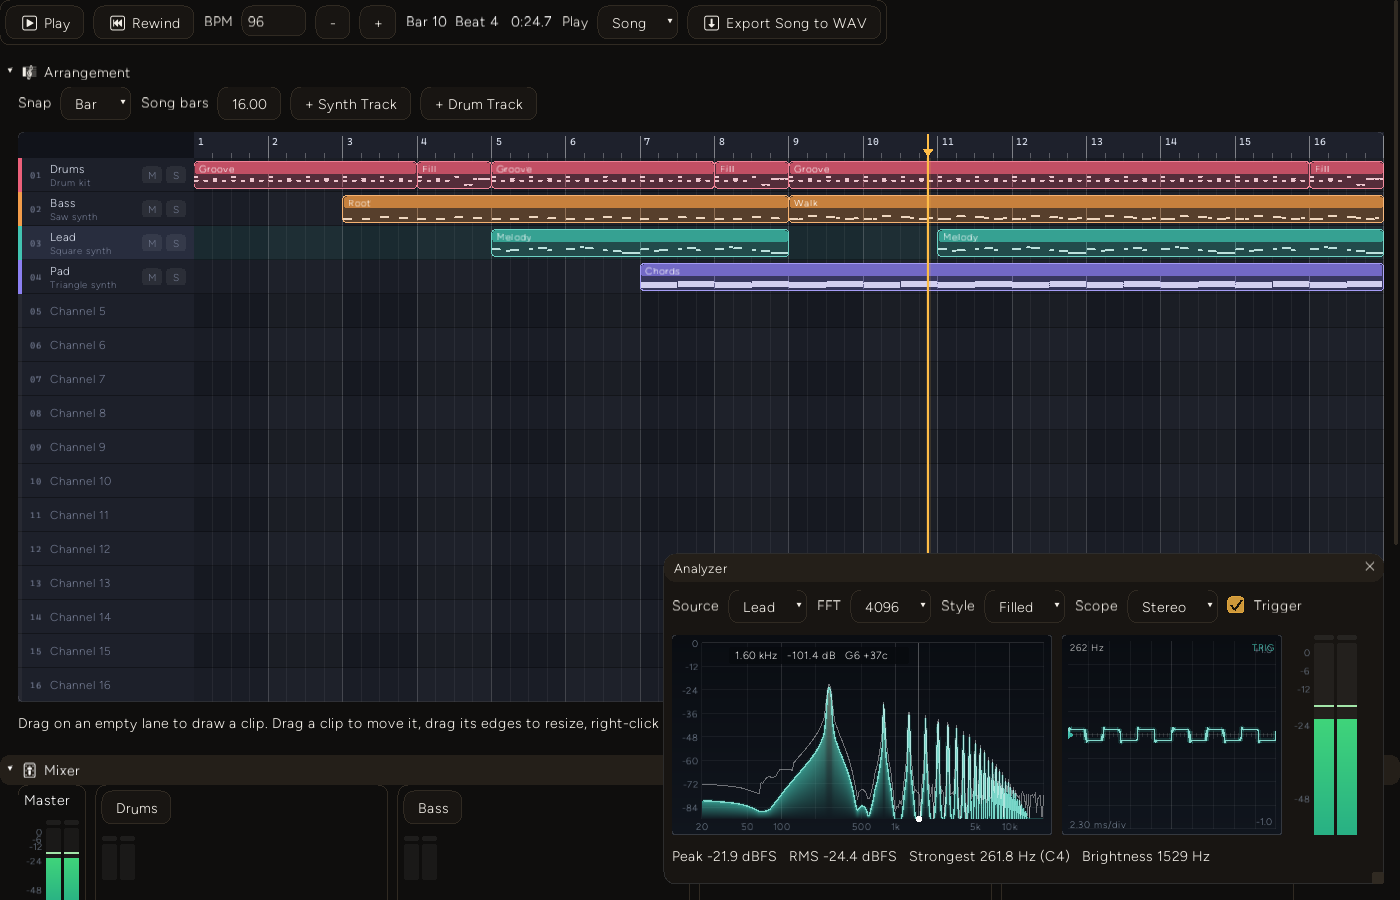
One previewed note on the Lead, which is a square wave rooted at C4. The spectrum shows what a square wave is: the fundamental, then only the odd harmonics, with the even ones missing as gaps in the comb. The scope is in the track's colour. The hover tag near 1.6 kHz is the real OS pointer resting over the plot.
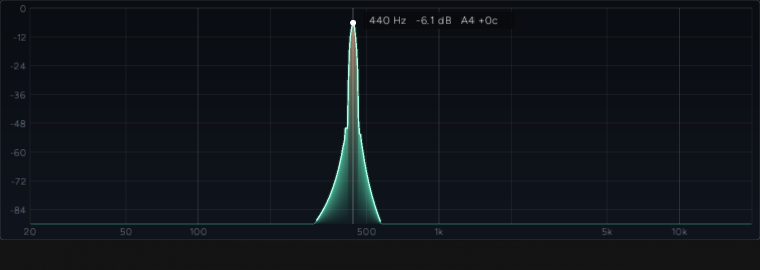
The hover readout in the headless tier: frequency, level and nearest note.
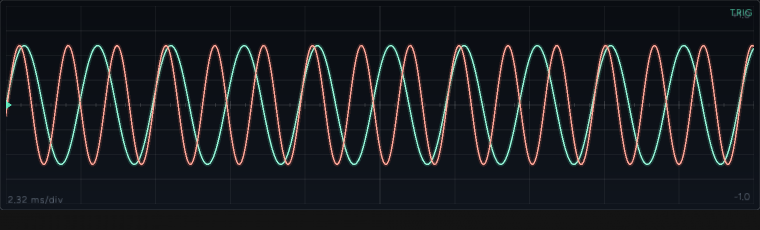
Stereo mode with different channels: 440 Hz on the left, 660 Hz on the right.
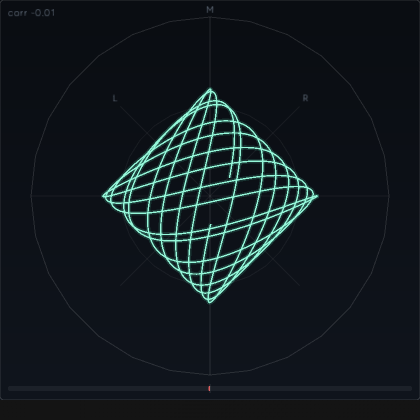
The goniometer with 300 Hz on the left and 470 Hz on the right. The channels are uncorrelated, so the figure fills the diamond and the correlation reads -0.01.
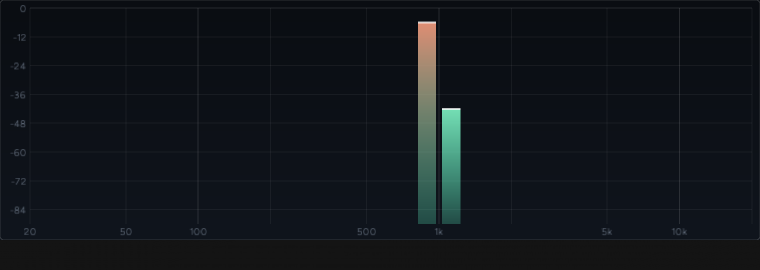
Bars style with a 1 kHz tone. The neighbouring bar is Hann leakage, roughly 36 dB down.
What the live run measured
The live run reads the audio engine's own taps and writes them into its result, so these are facts about the audio and not about pixels. Numbers are from a run on the machine in the frontmatter, and three consecutive runs agreed.
| Measurement | Value |
|---|---|
| Master, nothing playing | -120 dBFS (silent) |
| Master tap frames between the idle read and the song read | 84,562 in 1.92 s, which is real time at 44.1 kHz |
| Master peak over the 1.8 s the song played (83,976 frames covered) | -2.2 dBFS |
| Drum track peak over the same interval | -2.7 dBFS |
| Master, 2.5 s after Stop | -120 dBFS |
| Lead, one preview of row 0 | 261.8 Hz (C4 is 261.63) |
| Bass, one preview of row 0 | 65.5 Hz (C2 is 65.41) |
| Spectral centroid, bass against lead | 1,329 Hz against 1,529 Hz |
The bass is darker than the lead, but only by 200 Hz, because a saw is full of harmonics.
What it costs
audio_analysis_bench, cargo build --release, run as target/release/audio_analysis_bench.exe. The output starts with build: debug_assertions off, optimised, since a debug build would make every figure meaningless. The GPU is not involved: the drawing figures are the time to build each widget's draw list through a headless Context, tessellation included.
| Operation | Median (min) |
|---|---|
AudioTap::push, on the audio thread | 1.26 ns per frame (1.22), 0.0055% of one core per tap |
| Copy 8,192 frames out of a tap | 24.5 us (10.1) |
| Peak and RMS since the last read, 735 frames | 2.4 us |
| Stereo spectrum, FFT 1024 / 2048 / 4096 / 8192 | 4.0 / 7.9 / 15.5 / 32.6 us |
| Spectrum widget, 380 px | 94 us, 2,193 vertices |
| Level meter | 24 us, 168 vertices |
| Oscilloscope, mono, 220 px | 229 us, 7,867 vertices |
| The DAW's whole Analyzer window (three widgets) | 538 us, 17,590 vertices |
A 60 Hz frame is 16,667 us, so the Analyzer window is about 3% of one. A second run of the tap benchmark gave 1.19 ns instead of 1.26, so treat the third digit as noise. These are single-machine, single-process numbers and not a criterion run.
The window figure used to be worse. The first measurement of the scope was 812 us and 19,797 vertices for a 220 px trace, and the whole window was 1,983 us and 41,447 vertices. The cause is in the failure notes.
Decision log
A real master bus, not summed taps. Discussed above: each track's tap has its own frame counter. The cost is that the track buses moved from one Sink each into the master mixer, which changes how a deleted track stops. Every existing suite still passes: vst3_live, daw_arrangement_live, both canvas features, the browser tier.
Read the audio Rust-side, do not pass samples to JS. A 4096-frame window through the op boundary is a lot of numbers to serialise 60 times a second, and the addon has nothing to do with them. I did not measure the JS route, so this is reasoning and not a result. What JS does get is a handful of numbers, through Audio.analyze, once a frame for the readout.
Meters read since the last frame, not a trailing window. A fixed window drops a short peak whenever a UI frame runs long. The engine scenario plays a 60 ms kick, waits 150 ms, and shows the trailing 20 ms window reading -120 dBFS while the meter's next read shows +3.0 dBFS. The cost is per-reader state, and a reader that stalls for more than 186 ms loses the oldest part.
A fixed dB fall rate, not an exponential release. My first spectrum fell exponentially toward the -120 dB floor. Starting 114 dB above it, the initial rate is several hundred dB per second, so the release was over inside a few frames. A constant 48 dB per second is what analyzers use.
Max-pool the treble, interpolate the bass. The alternative, averaging, hides a narrow peak. The cost is that a treble column reports the loudest bin in it, not the mean.
A window, not a section of the tab. The arrangement is 16 lanes tall, so a section under it is off screen exactly when you want to glance at a level, and one above it pushes the thing you are editing down the page. The cost is that by default the window covers the lower right of the arrangement, and you drag it away.
Glows get bevel joins, the core gets round. See the failure notes.
Failure notes
The first version of the tap reader tore under stress, and the first stress test was too weak to notice. A writer that finishes 2 million frames in about 4 ms leaves the reader almost no time to overlap it, and the test passed with the validation disabled. I rebuilt it as a writer that runs flat out, laps the 16,384-frame ring in tens of microseconds, and a reader that takes maximum-size copies for 600 ms. That failed with the validation on: torn snapshot ending at frame 348073: 344271 then 360656, a jump of exactly 16,385. Two things were wrong. My fallback after eight failed attempts returned the last, torn, copy. It now trims to the surviving suffix. And a seqlock reader needs an acquire fence between the data loads and the re-check, with a matching release fence in the writer. After the fix a flat-out writer produces between a third and nearly half trimmed snapshots over three runs, and none torn. Removing the fences changes nothing on this machine. x86's memory model and this compiler's codegen make them no-ops here, so I cannot show that they are necessary. They are there because the memory model requires them, and on ARM I expect them to matter.
A meter's first read can happen before the audio thread has produced a frame. The cursor it stores is then 0, and a "0 means never read" check treated the second read as a first, looking back one UI frame instead of the whole interval. The engine scenario read a peak of 0.0 from a 60 ms kick. The cursor is an Option now, and a unit test pins the case.
A new meter drew a full-scale bar. Its state started at f32::default(), which is 0 dBFS, and drained at the fall rate for two seconds after every open. The pixel tier renders a fresh meter as its "unlit" baseline, and the baseline was lit.
Painter::text silently ignored most alignments. It matched only LEFT_TOP, LEFT_CENTER and CENTER_CENTER and drew everything else top-left of the anchor. My right-aligned dB labels would have been drawn on top of the plot. It now honours every combination, and the three old cases give identical results. This is a change to the shared kit, and I re-ran every suite after it.
The spectrum drew a -6 dBFS tone at -1.7 dBFS. The interpolation ran on dB values, and a Hann lobe has nulls two bins from its peak at around -100 dB. A cubic through them swings above the data. Interpolating in linear amplitude and clamping fixed the interpolation. The default miter join on the outline then put a spike on every sharp apex and still read -4.6 dBFS at 1 kHz. Round joins brought it to -6.7. The picture test could not see the interpolation overshoot once the joins were fixed, so a unit test guards it.
Two assertions were wrong, not the widgets. A "curve top" measured on the pixels was fooled by the peak-hold marker, which is the old curve and merges into the fill on a pointed lobe. I separated them by saturation, which needed a threshold measured against the actual blended colours. And clicking: clicked is true on the frame the button goes down, and my step read the response from the frame it came up.
A one-window assertion was flaky in the live tier. "The drum track is audible while the song plays" read a single 93 ms window and landed in a gap between hits on a re-run (-120 dBFS). It now measures over the whole interval: the driver polls the taps every frame with the same since-last-read reader a meter uses and keeps the running peak. The interval reading is -2.2 dBFS for the master. Single 93 ms windows of the same song read -19.1 dBFS in one run and -20.2 dBFS in the screenshot above. A meter that samples an instant under-reports this mix by about 17 to 18 dB.
An app with a tab and a window lost its labels. The live driver's "I see the label" reads a list that the tab pass fills and the window pass then cleared. Nothing had both until the Analyzer window. daw_arrangement_live failed with visible labels: ["Silent."]. The window pass now appends when the tab pass already filled the list.
The scope's second channel hid the first. With a centre-panned mono source both channels are identical, so the right-channel trace drew salmon over the track's colour. It shows in the first live screenshot I took. Identical channels now collapse to one trace.
The scope was too expensive. 0.8 ms and about 20,000 vertices for a 220 px trace. The zig-zag that keeps narrow peaks turns nearly 180 degrees at every column, and each turn got a round join, an arc. Translucent glows and afterglow trails now use bevel joins, the tessellation tolerance is half a pixel, the two halo passes are one, and the afterglow stores a trail every quarter of its persistence, not every frame. The window went from 1,983 us to 538 us, and the small scope from 812 us to 229 us. The stereo 720 px scope with afterglow is still 1.14 ms.
The vitest suite's mini Gherkin parser rejected prose under Feature:. A prose line before the first scenario cannot be a step, so it is skipped there. An unrecognised line inside a scenario still fails loudly.
One pre-existing failure, not from this work. Running vitest across the whole bundle reports tests/index.test.ts as "No test suite found": the file is entirely commented-out template code. Everything else passes.
Limits
- Windows only, on the machine in the frontmatter. I did not pin or log the audio backend or the wgpu backend.
- Nobody has listened to this. The live tier asserts levels, pitch and timing from the engine's own taps, and the numbers can only be true if the mix reached the master bus. Whether it sounds right needs a person. I did not check the analyzer against VST3 audio, though VST3 sources feed the same bus.
- The headless pictures come from a CPU rasterizer I wrote for the test, not the wgpu renderer. The live screenshots are the real thing.
- Peak levels are subject to Hann scalloping of up to 1.4 dB. There is no flat-top window option.
- The media player's audio goes to the stream through its own sink, not the master bus, so it is not analysed.
- No spectrogram. The Analyzer window covers part of the arrangement until you move it.
- The engine runs at a fixed 44.1 kHz and the output device's resampling happens after the master bus, so the analyzer sees the engine's rate, not the device's.
- The tap ring keeps 371 ms and a since-last-read query is capped at 186 ms, so a reader that stalls longer loses the oldest frames.
- The benchmark is one machine and one process, not a criterion run. The tap figure varied 1.19 to 1.26 ns across two runs.
- The work is uncommitted, so there is no tag.
What's next
Tracked on the project's kanban board: a spectrogram (a scrolling waterfall is the natural next widget, and the FFT already exists), and a limiter or effect chain on the master bus, which now exists to hold one. On the testing side, an analysis of VST3 audio in the live tier, routing the media player through the master, and a flat-top window for honest peak levels. The DAW's existing backlog also still stands: solo does not dim the other lanes, the mixer runs off the right edge past four strips, and note timing is quantized to the JS frame.